2026
Canopy Return
A tree counts only when it survives — and every euro can be followed to the ground.
A reforestation nonprofit site that proves impact: live planting map, transparent ‘where your money goes’ and a monthly-giving flow.
A self-initiated concept, designed like a real product.
The brief we set ourselves
Design the site of a reforestation nonprofit that proves its impact instead of claiming it: a counter of trees that survived, a map of every planting block, project stories with data, a transparent «where your €1 goes» and a monthly-giving flow.
Who it is for
Climate-concerned donors aged 25–55 who want to see what their money did, and corporate CSR partners who need reportable numbers.
What we designed
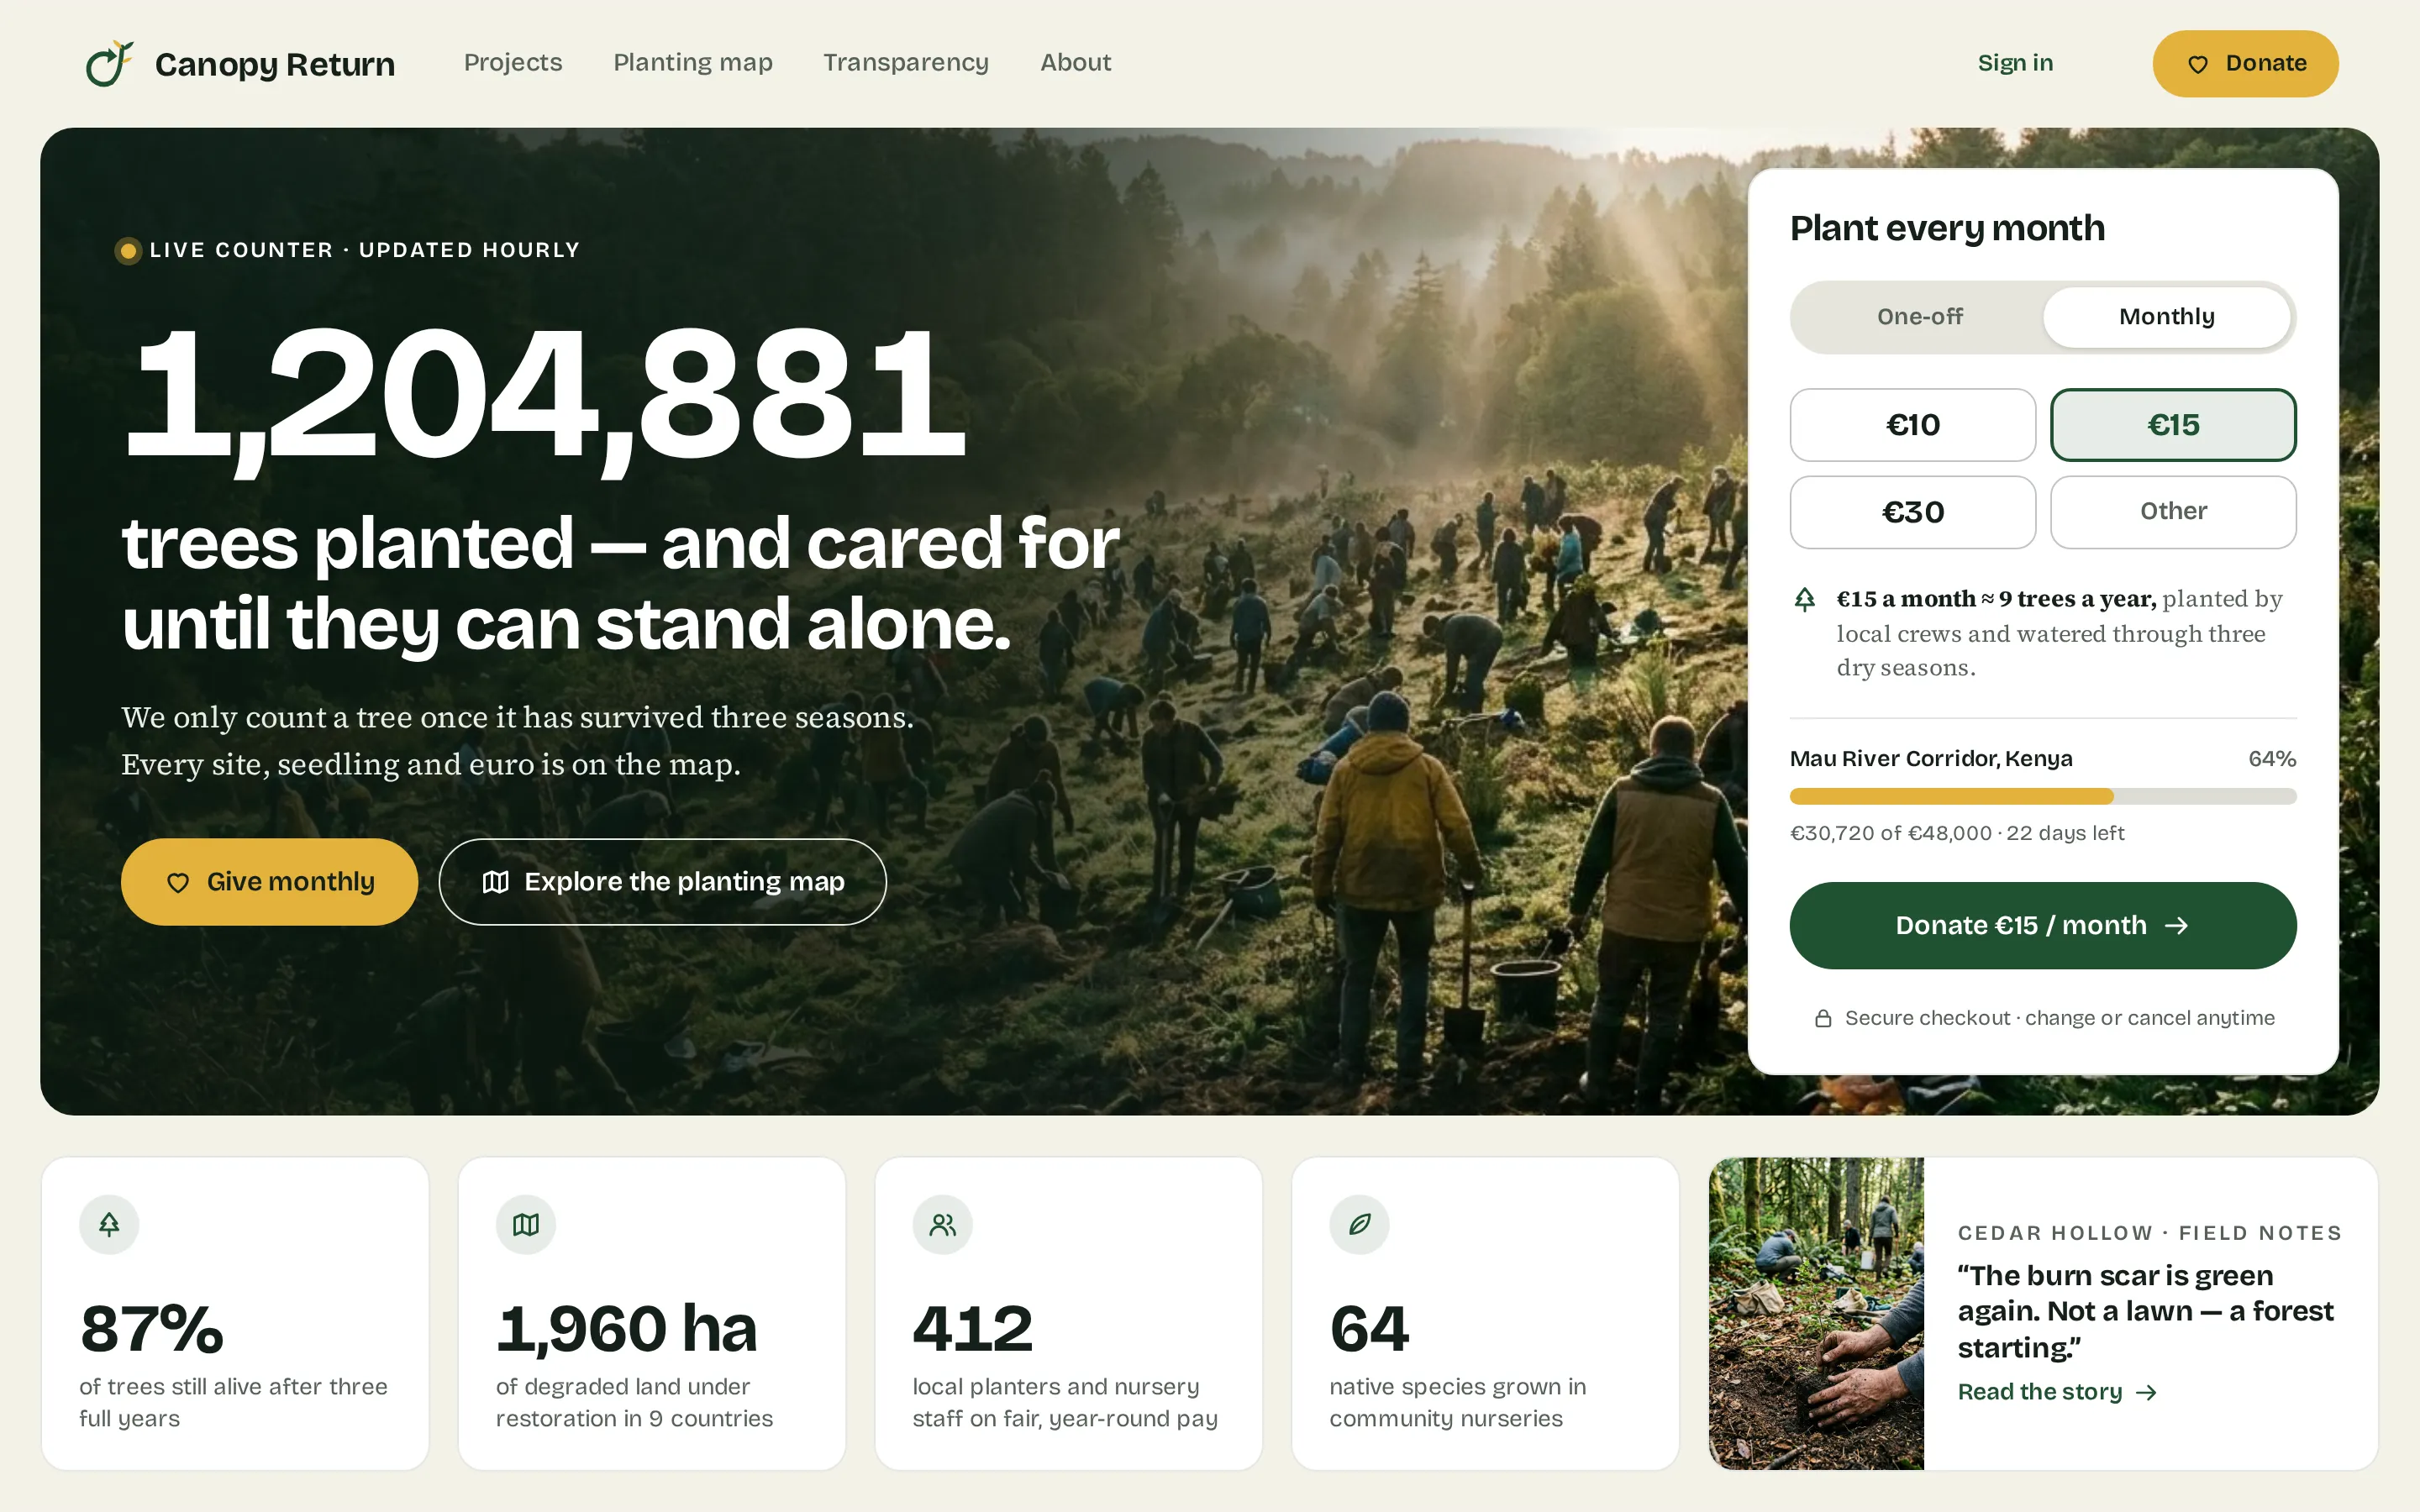
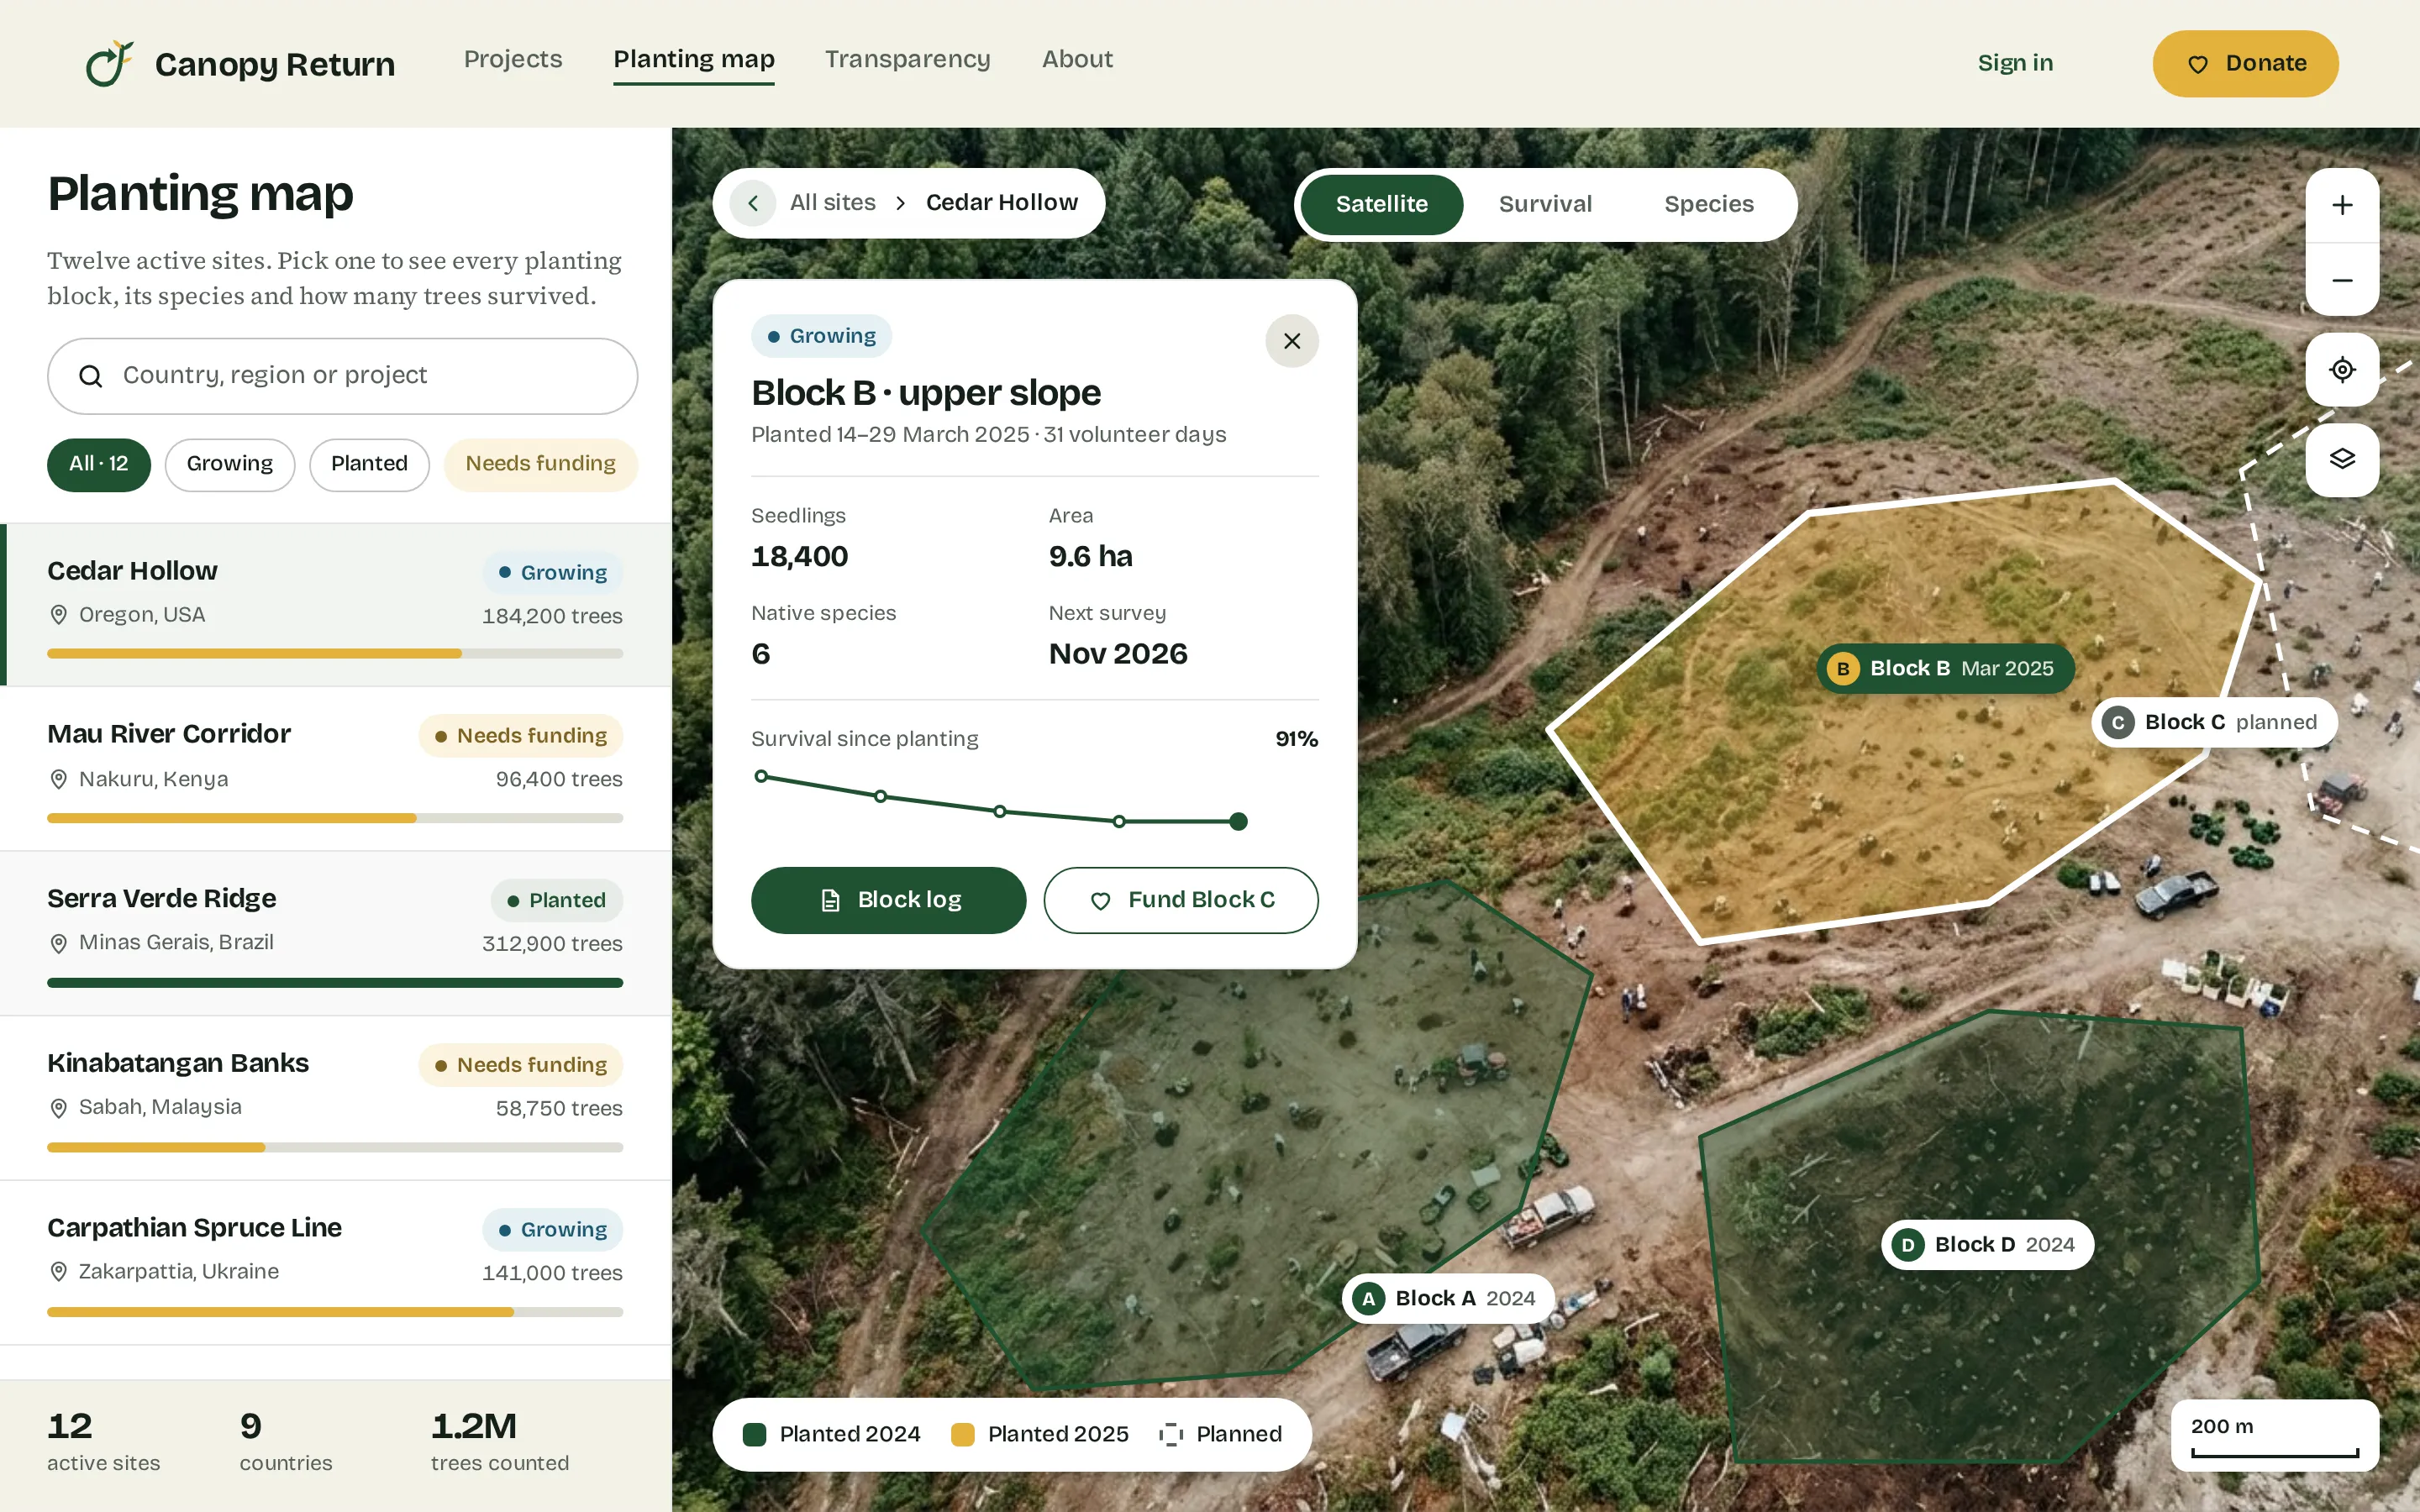
Home with the impact counter and a donation card, a planting map with blocks drawn over an aerial photo, a project story with a survival chart, and step 3 of monthly giving with the money breakdown.
Design facts from the concept files — not business results.
02ResearchDonors give monthly when they can see it working.
We read the 2026 fundraising benchmarks, collected nonprofit and reforestation web work on Dribbble and Behance, and looked for the gap between «we planted a million trees» and proof.
We read the 2026 fundraising benchmarks, collected nonprofit and reforestation web work on Dribbble and Behance, and looked for the gap between «we planted a million trees» and proof.
- Giving
M+R Benchmarks 2026: nonprofit online revenue grew 15% in 2025, and monthly giving made up 27% of online revenue.
DecisionMonthly is the default on every donation card, with the impact of the exact amount — «€15 a month ≈ 9 trees a year» — written next to it.
- Proof
Planting-count headlines are everywhere; survival rates, maps of the actual blocks and money breakdowns are rare in the work we collected.
DecisionCount only trees that survived three seasons, map every block with its year and survival, and show the €1 split right in the checkout.
- Story
Data alone feels cold, and a photo alone feels like marketing.
DecisionPhoto-led cards with data on the image: a planting week photo carries trees, hectares and species; the story page pairs a survival chart with hands in the soil.
Patterns we borrowed
- Nonprofit sites
- A donation card on the hero with one-off / monthly and preset amounts
- Mapping tools
- Satellite view with layers, zoom, a legend, a scale bar and a popover per area
- Annual reports
- A donut of where the money goes with a legend and the report link
- Checkout flows
- A three-step progress, card validation inline and optional fee cover
What we left out
Logos, maps, photos and figures of any real reforestation organisation. Canopy Return has its own name and mark; photos and the aerial view are concept images from the Fond.
Moodboard references
From a donate button to an impact you can audit.
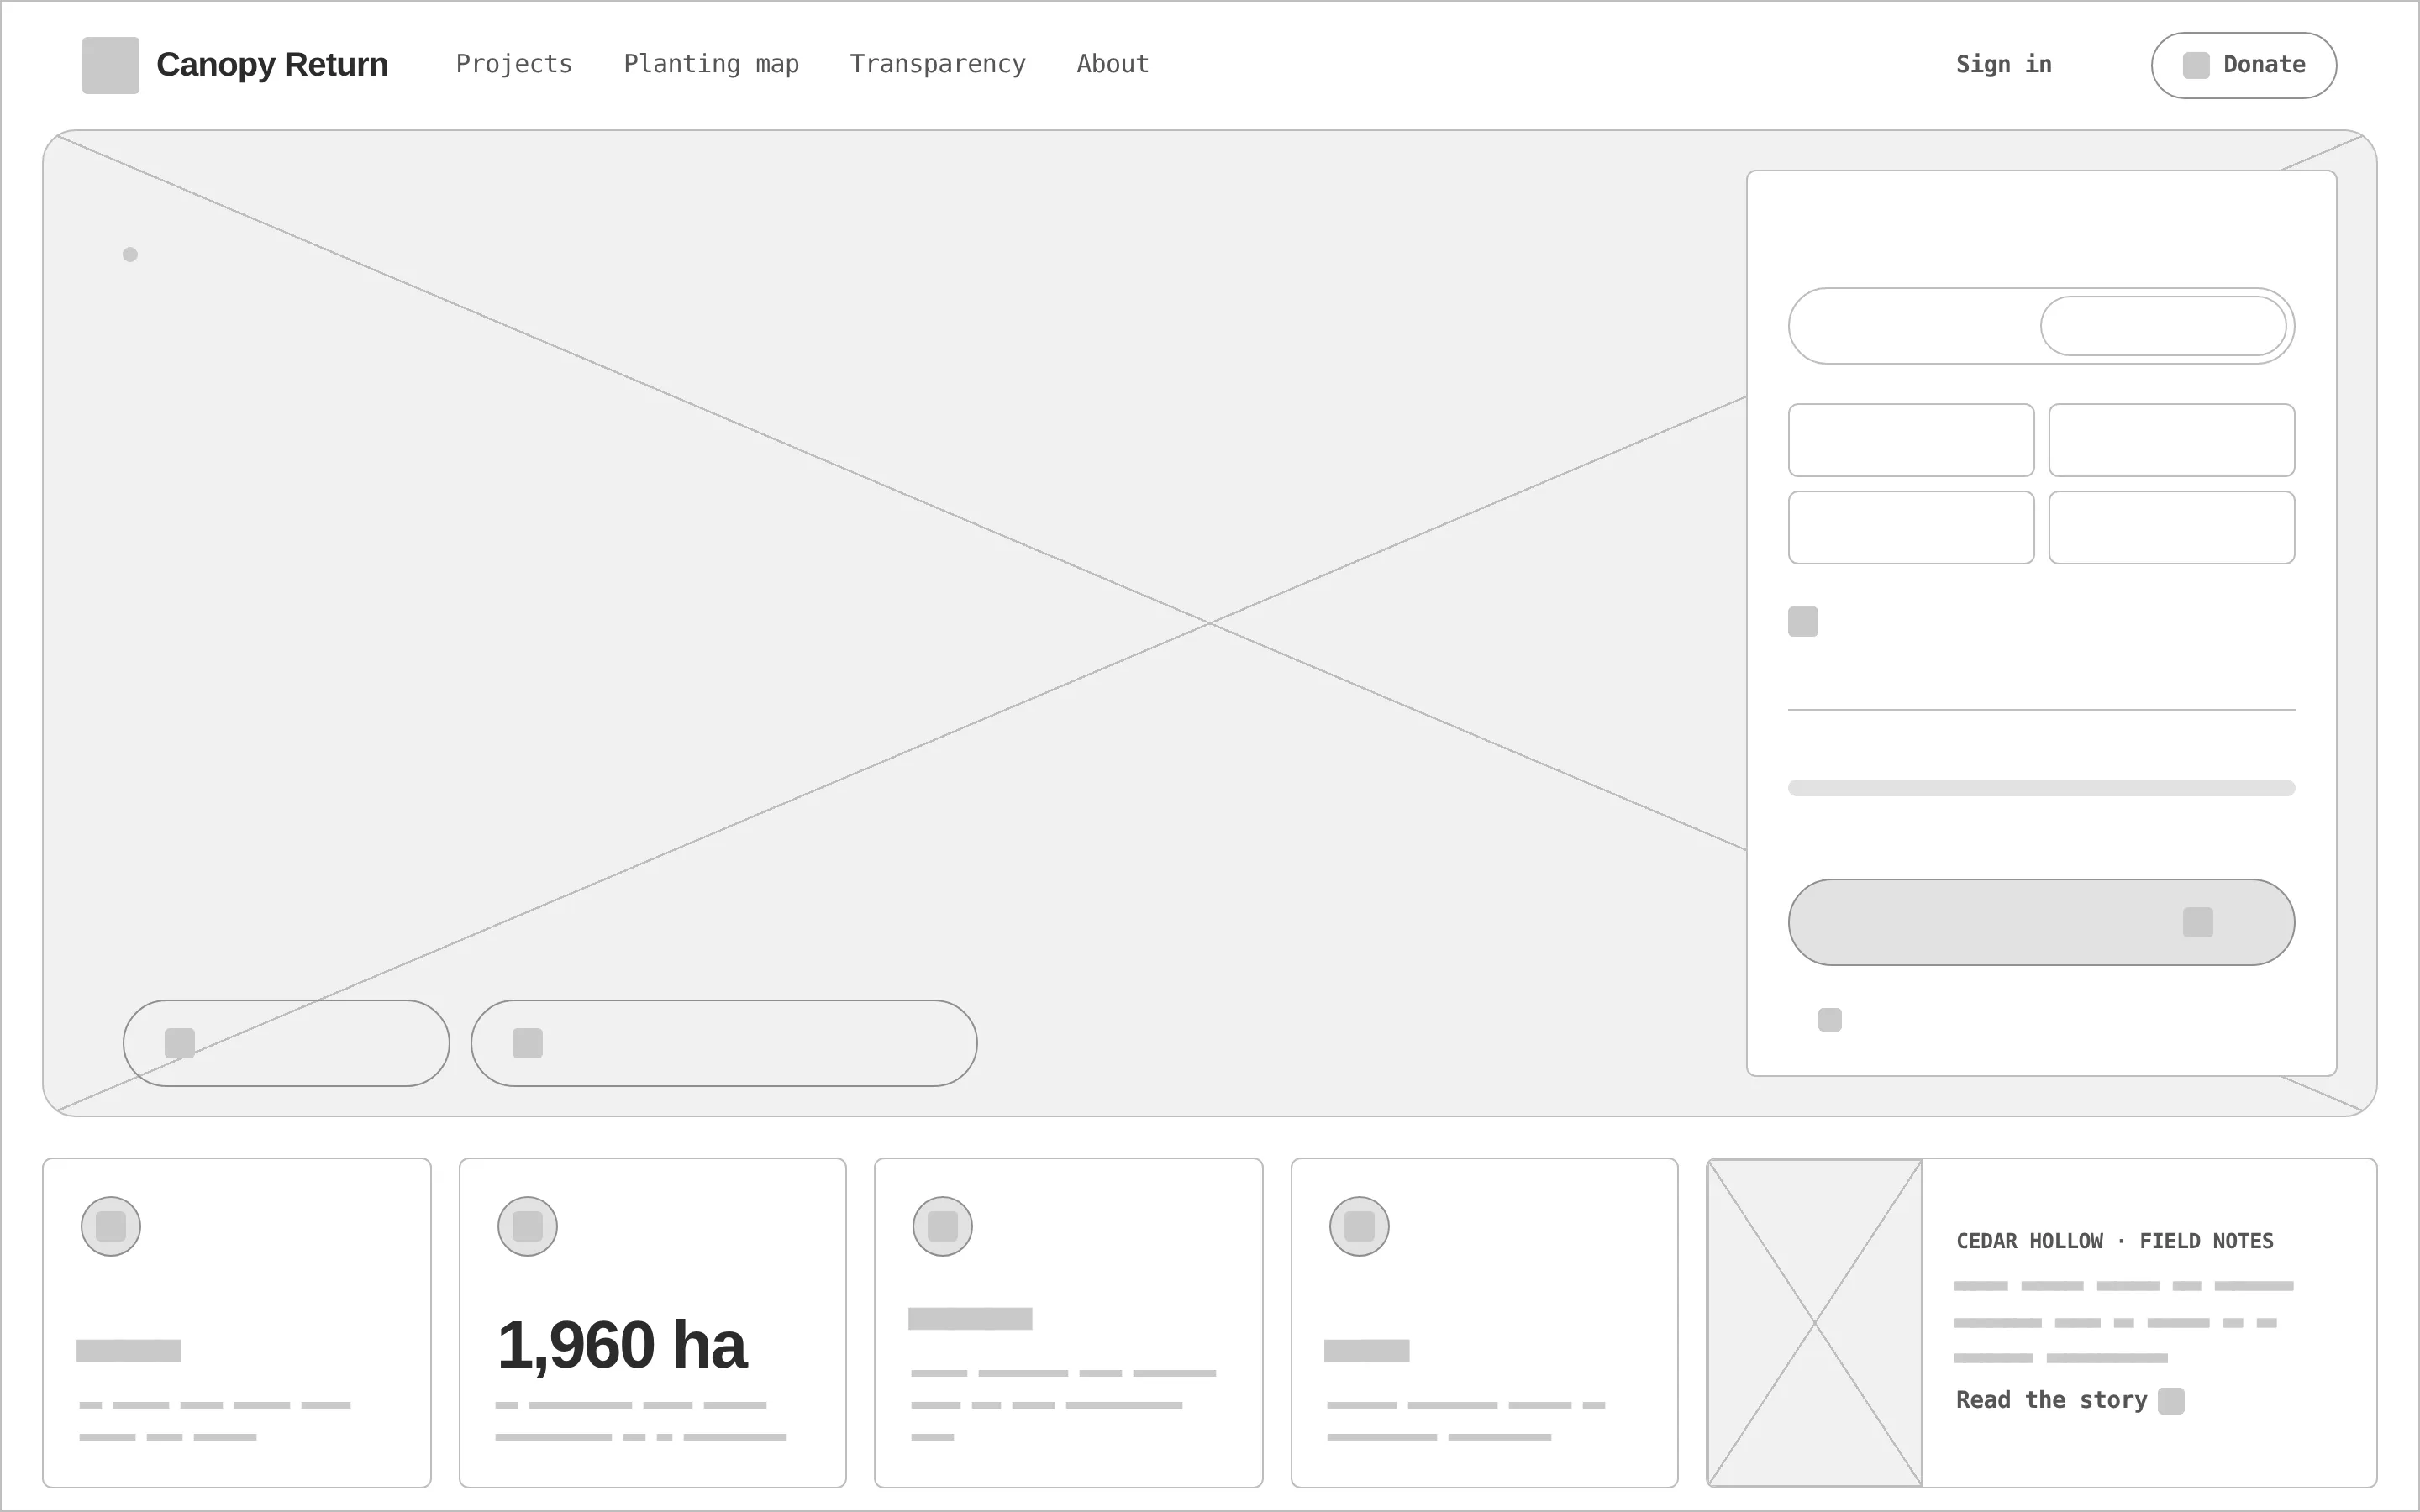
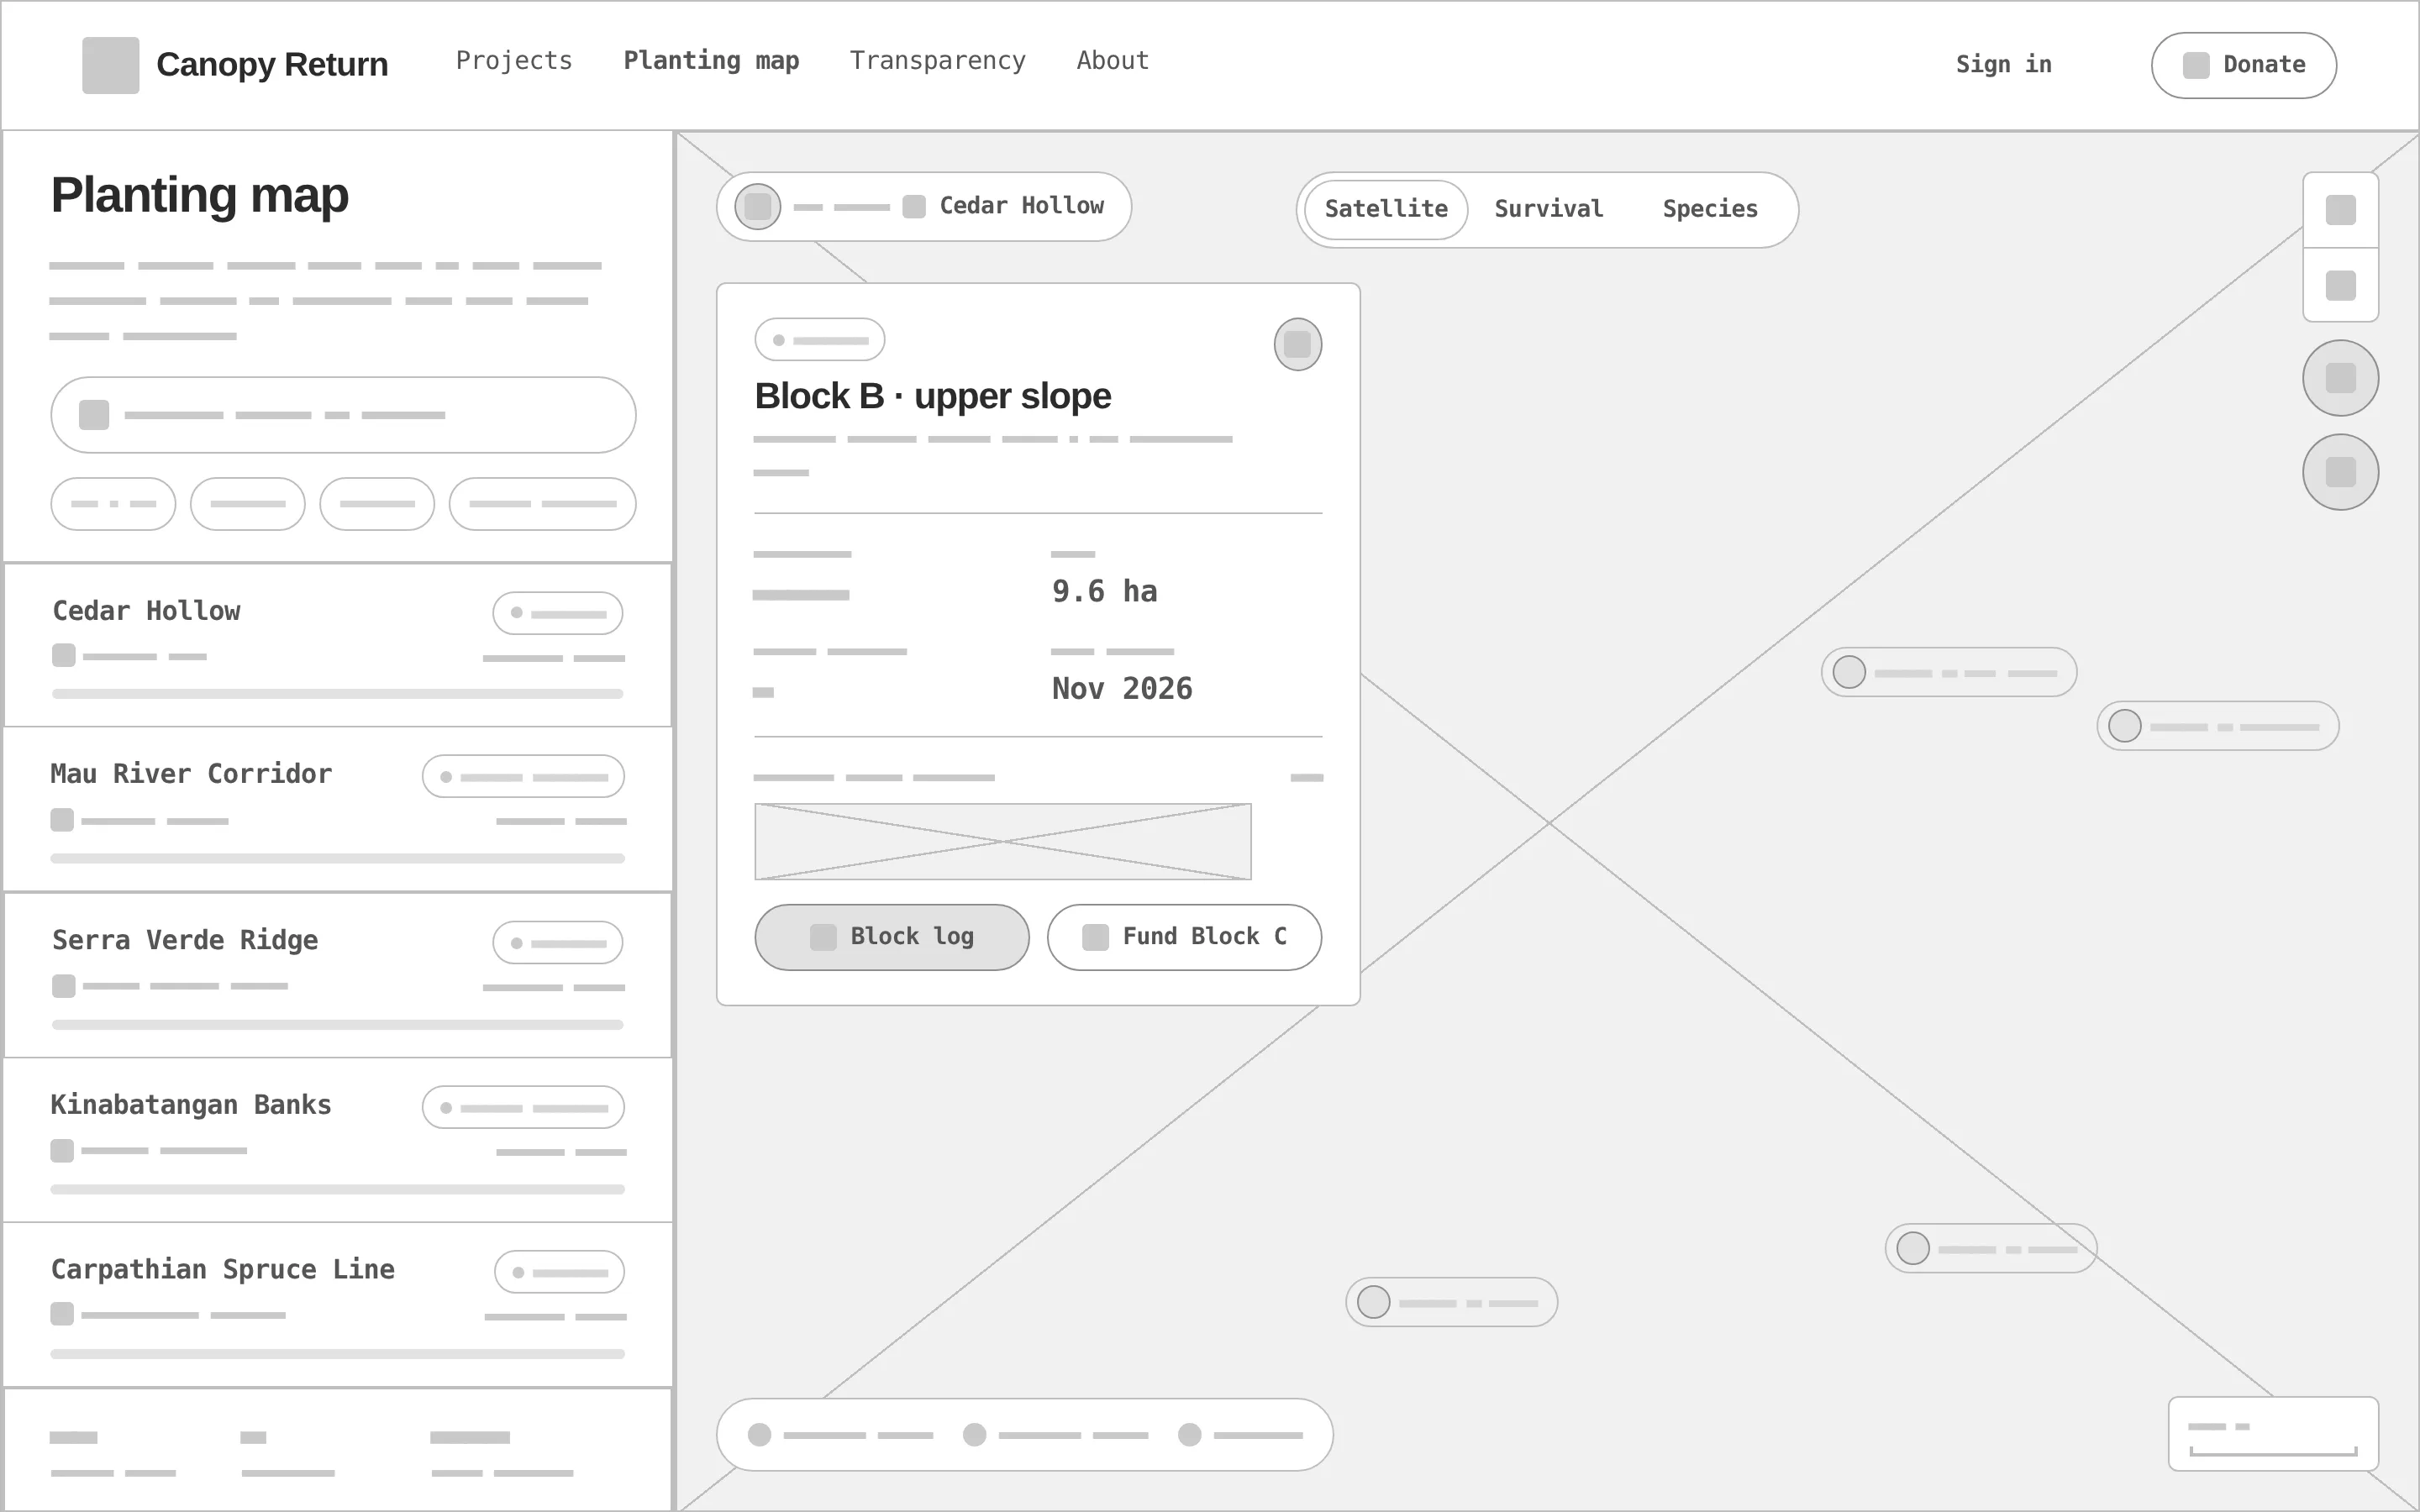
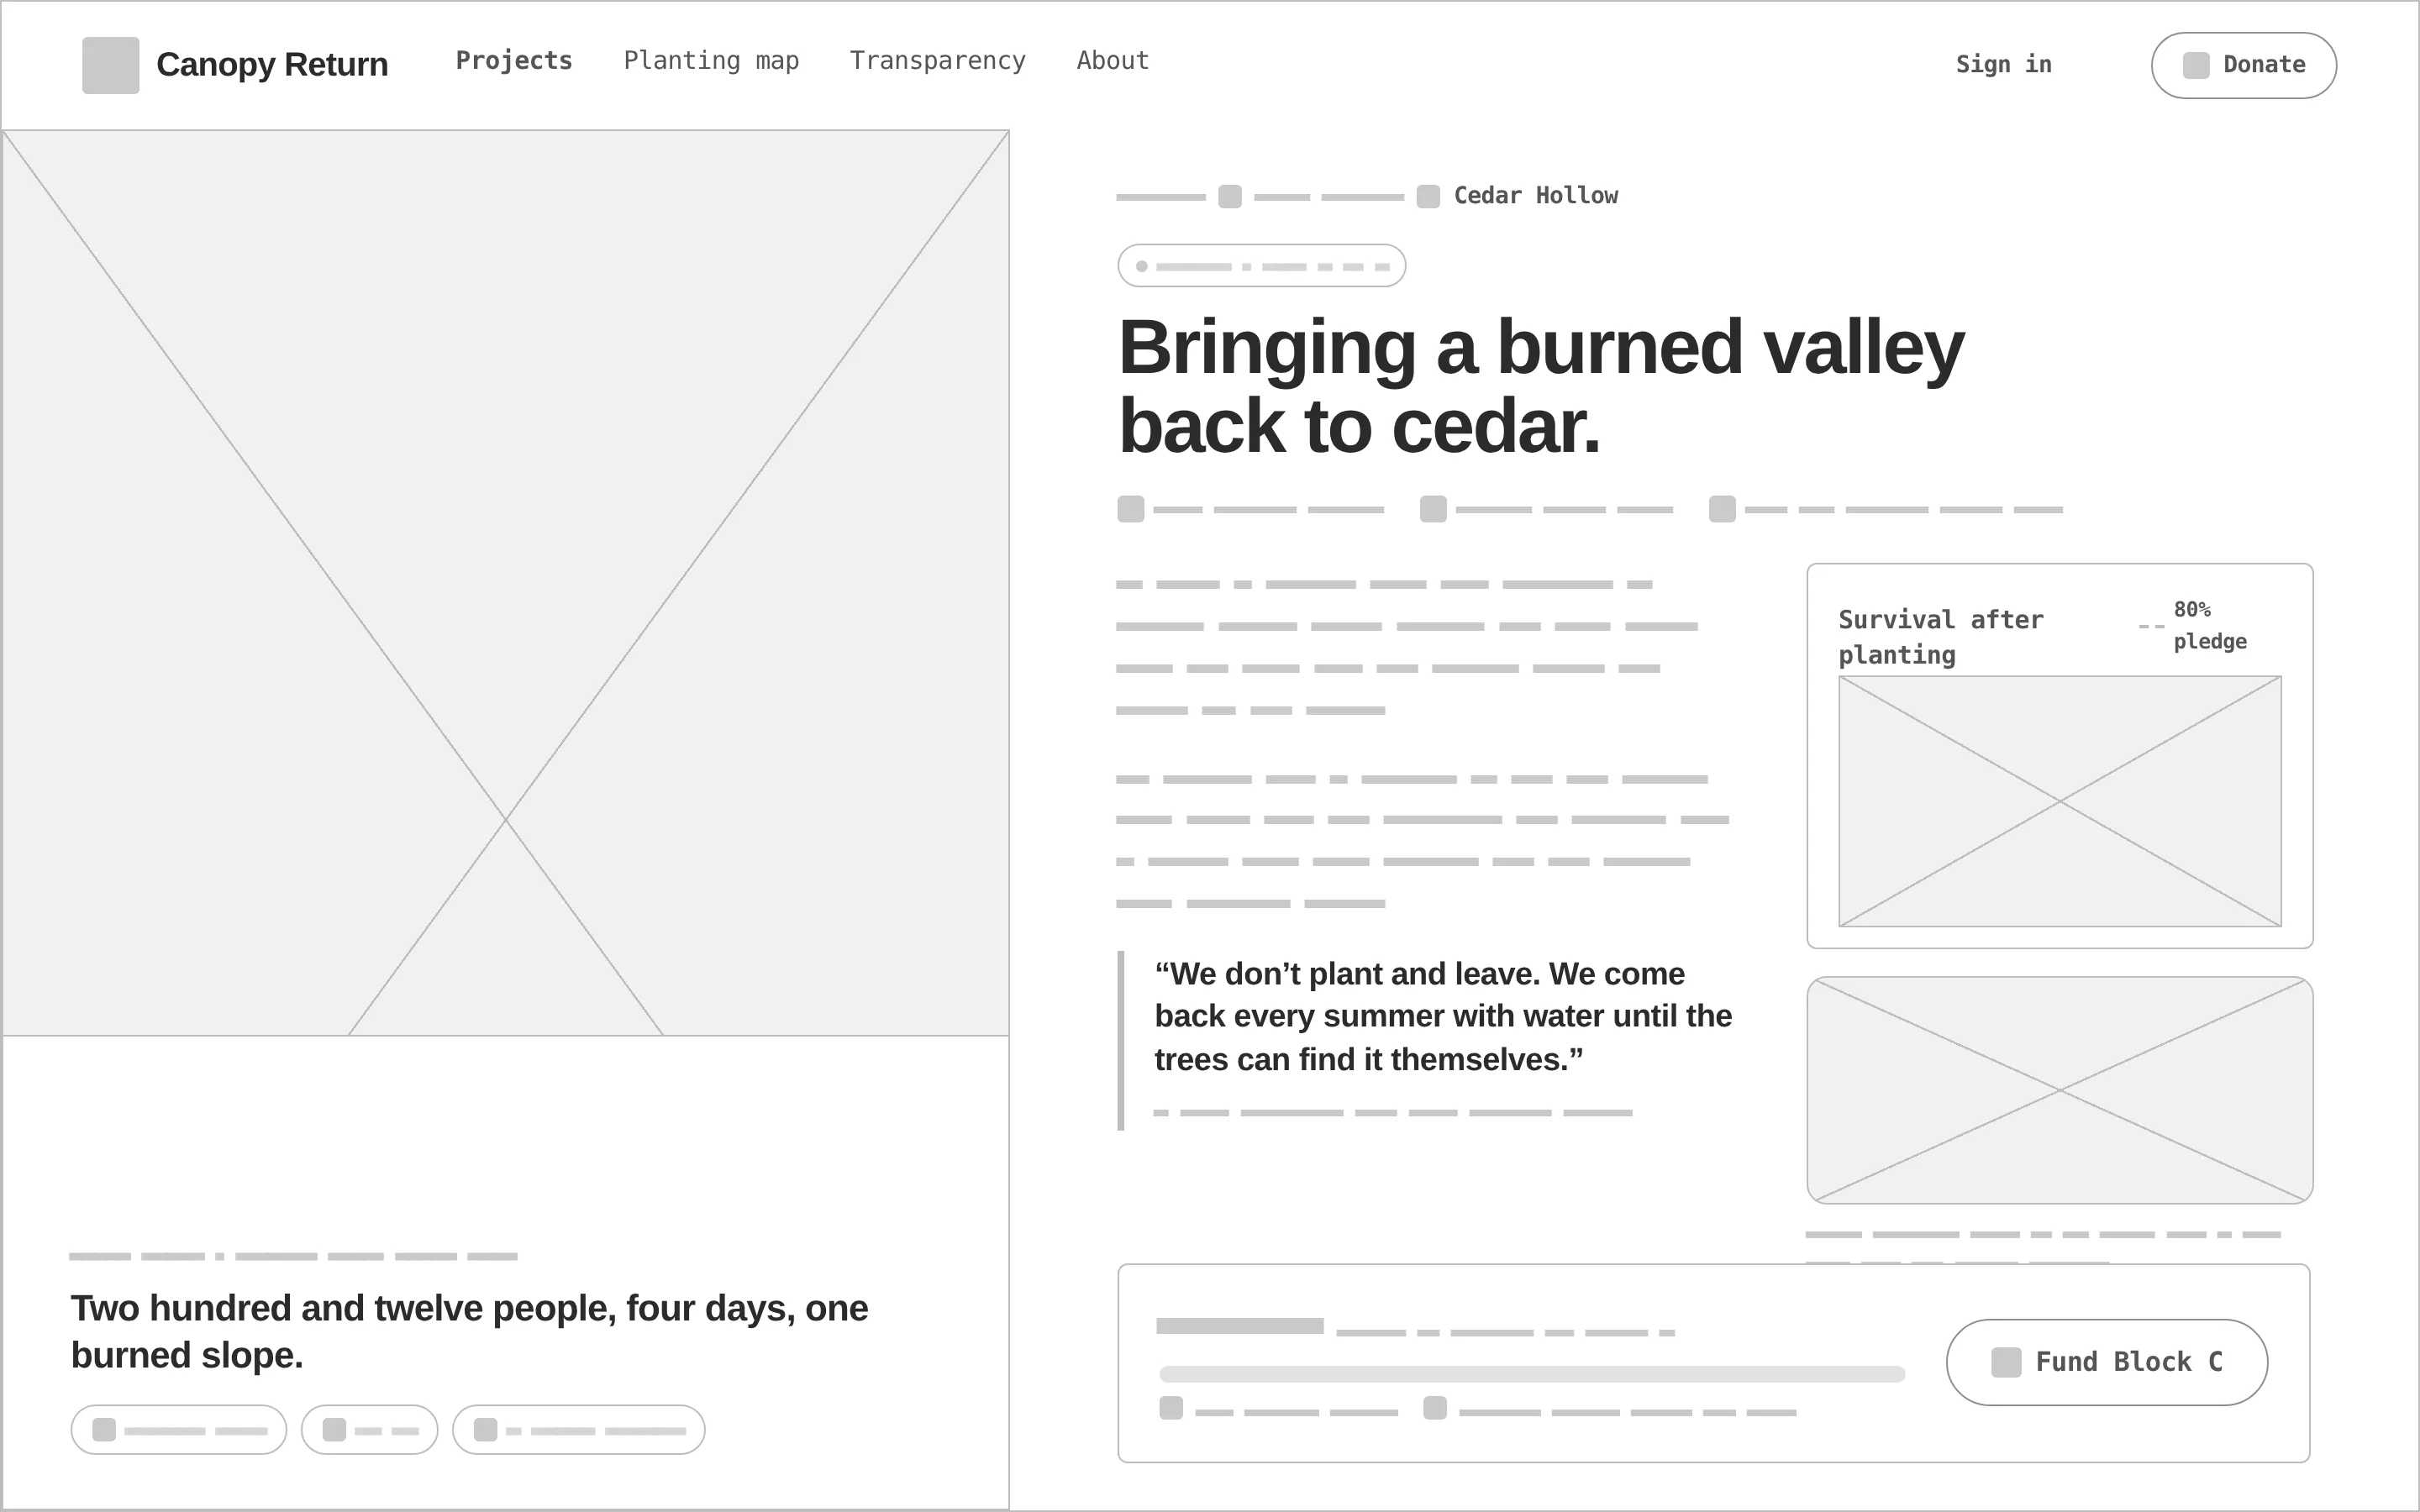
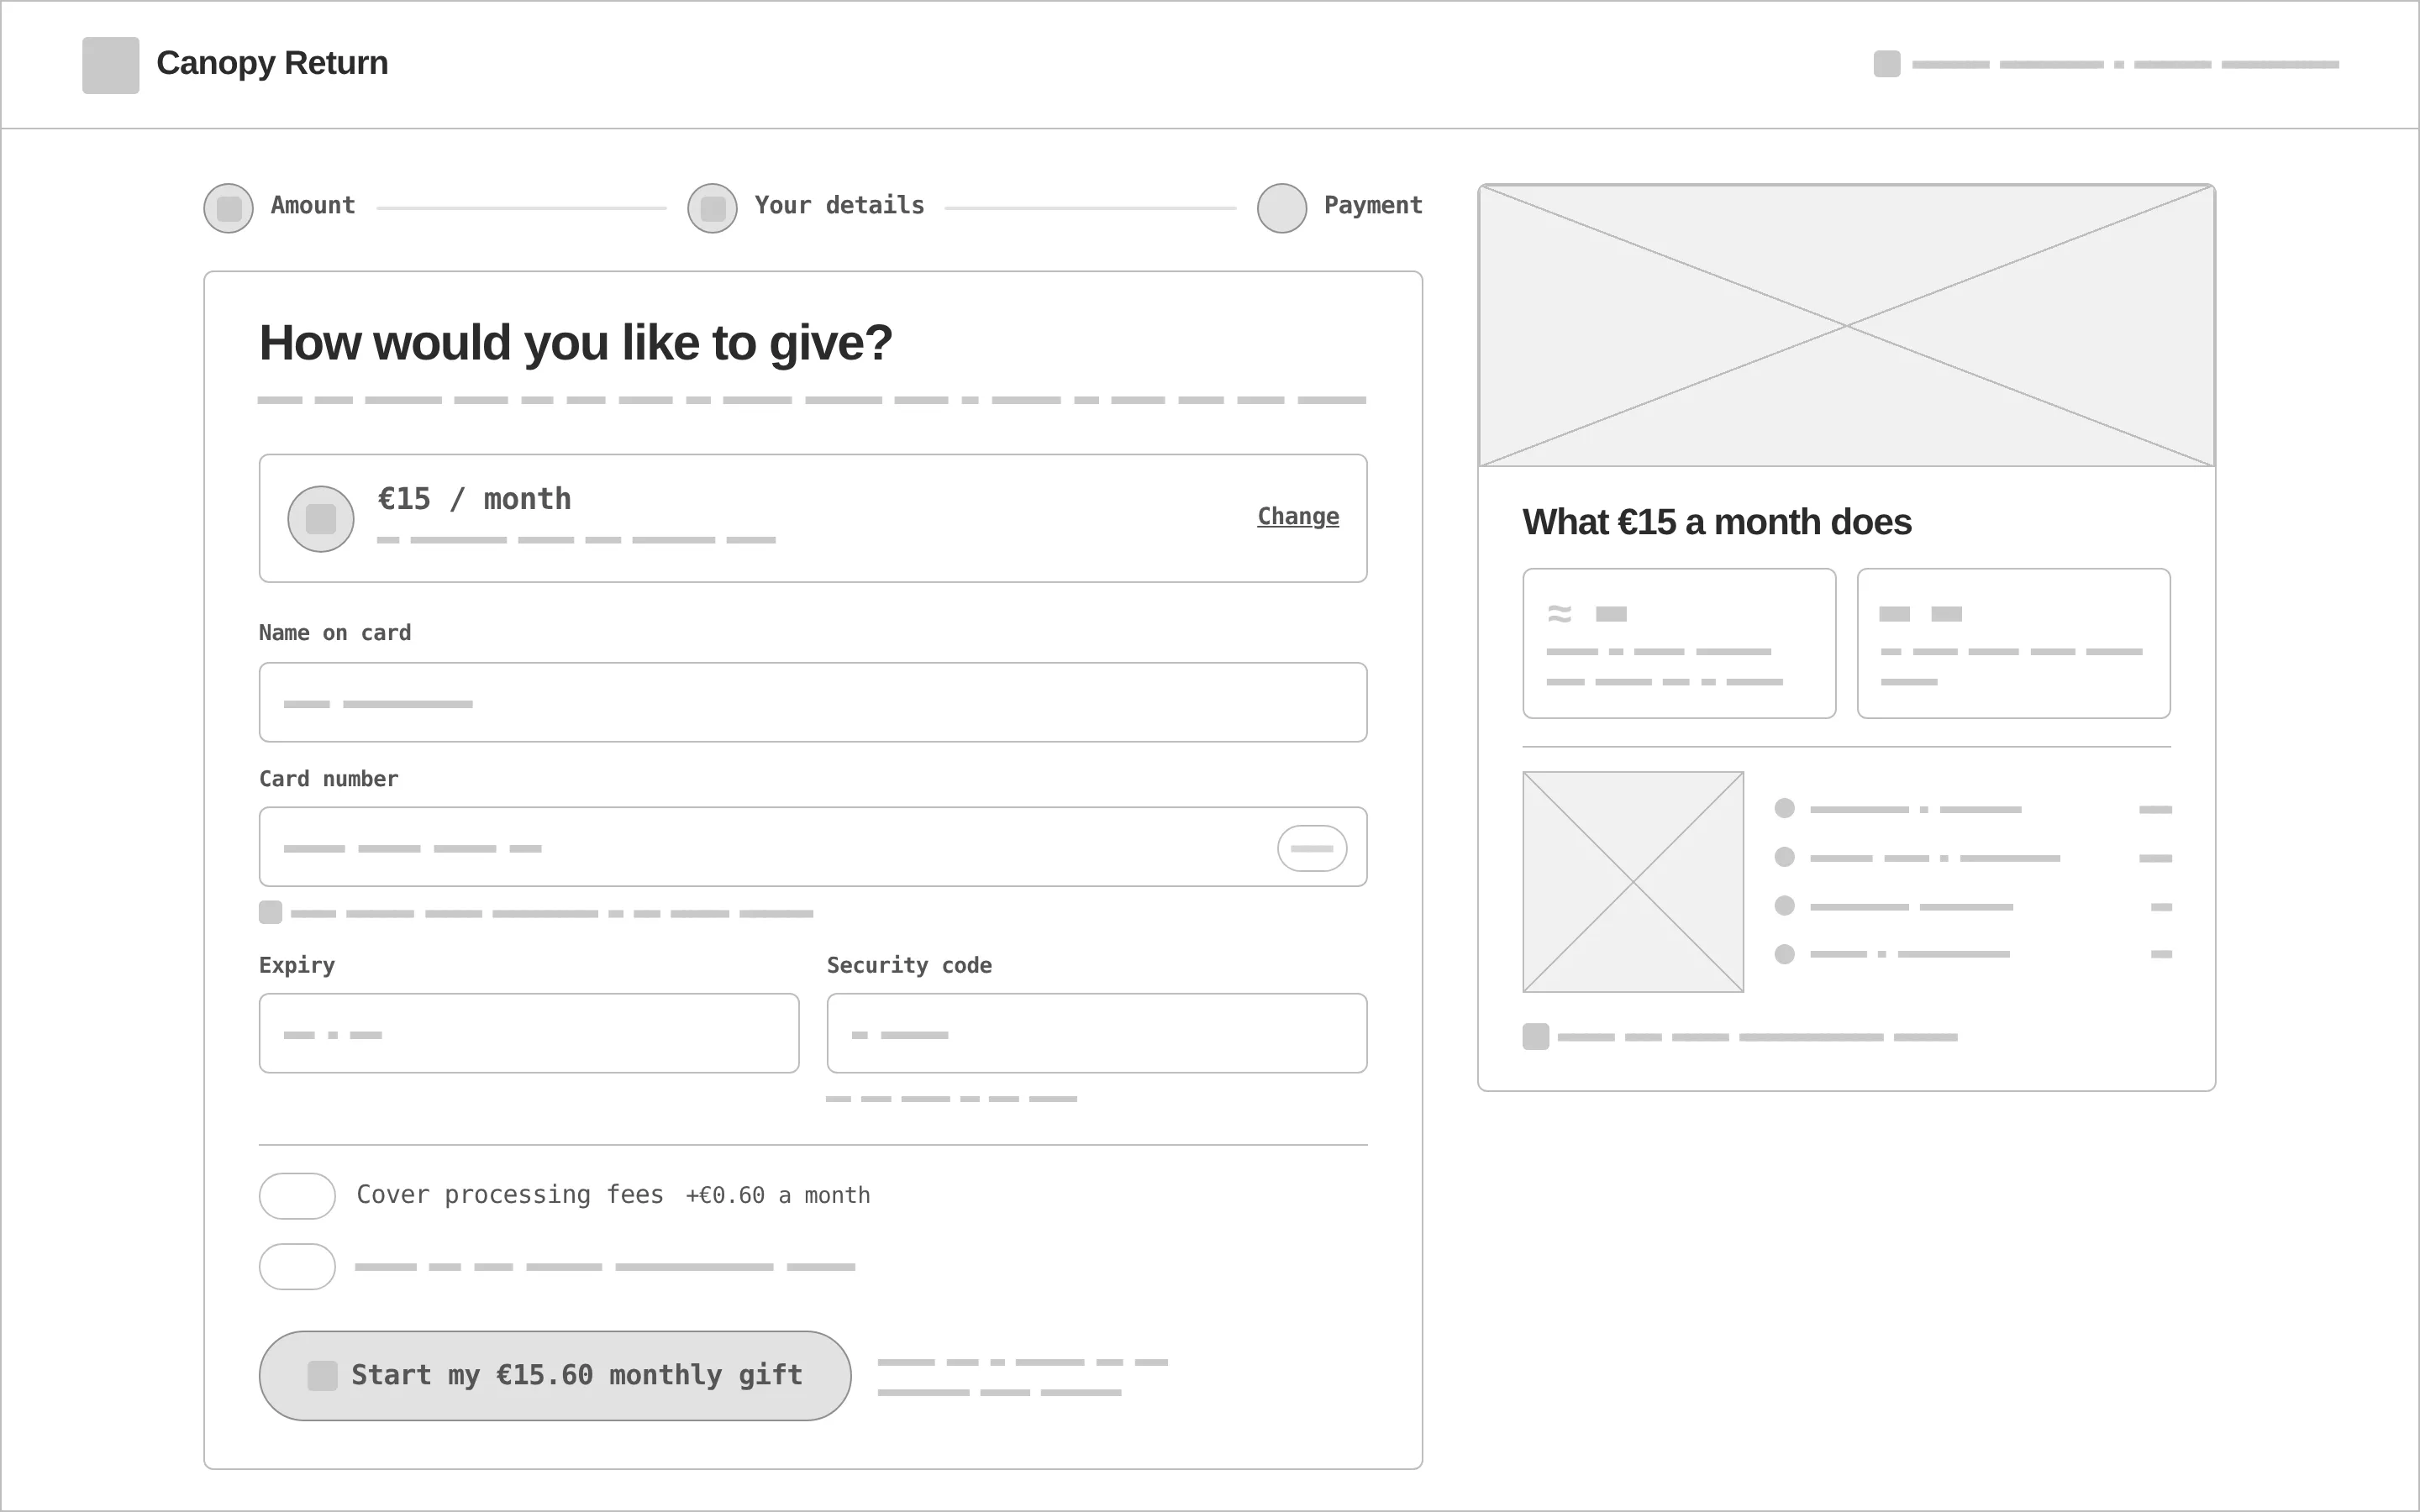
Every «before» is generated from the very same page markup, reduced to outlines, readable labels and grey word-bars — no colour, photos or map. Drag a handle to compare.
- 01
Hierarchy
The counter and its condition — «cared for until they can stand alone» — come before the ask; the donation card shows the impact of the selected amount before the button.
- 02
Grid & density
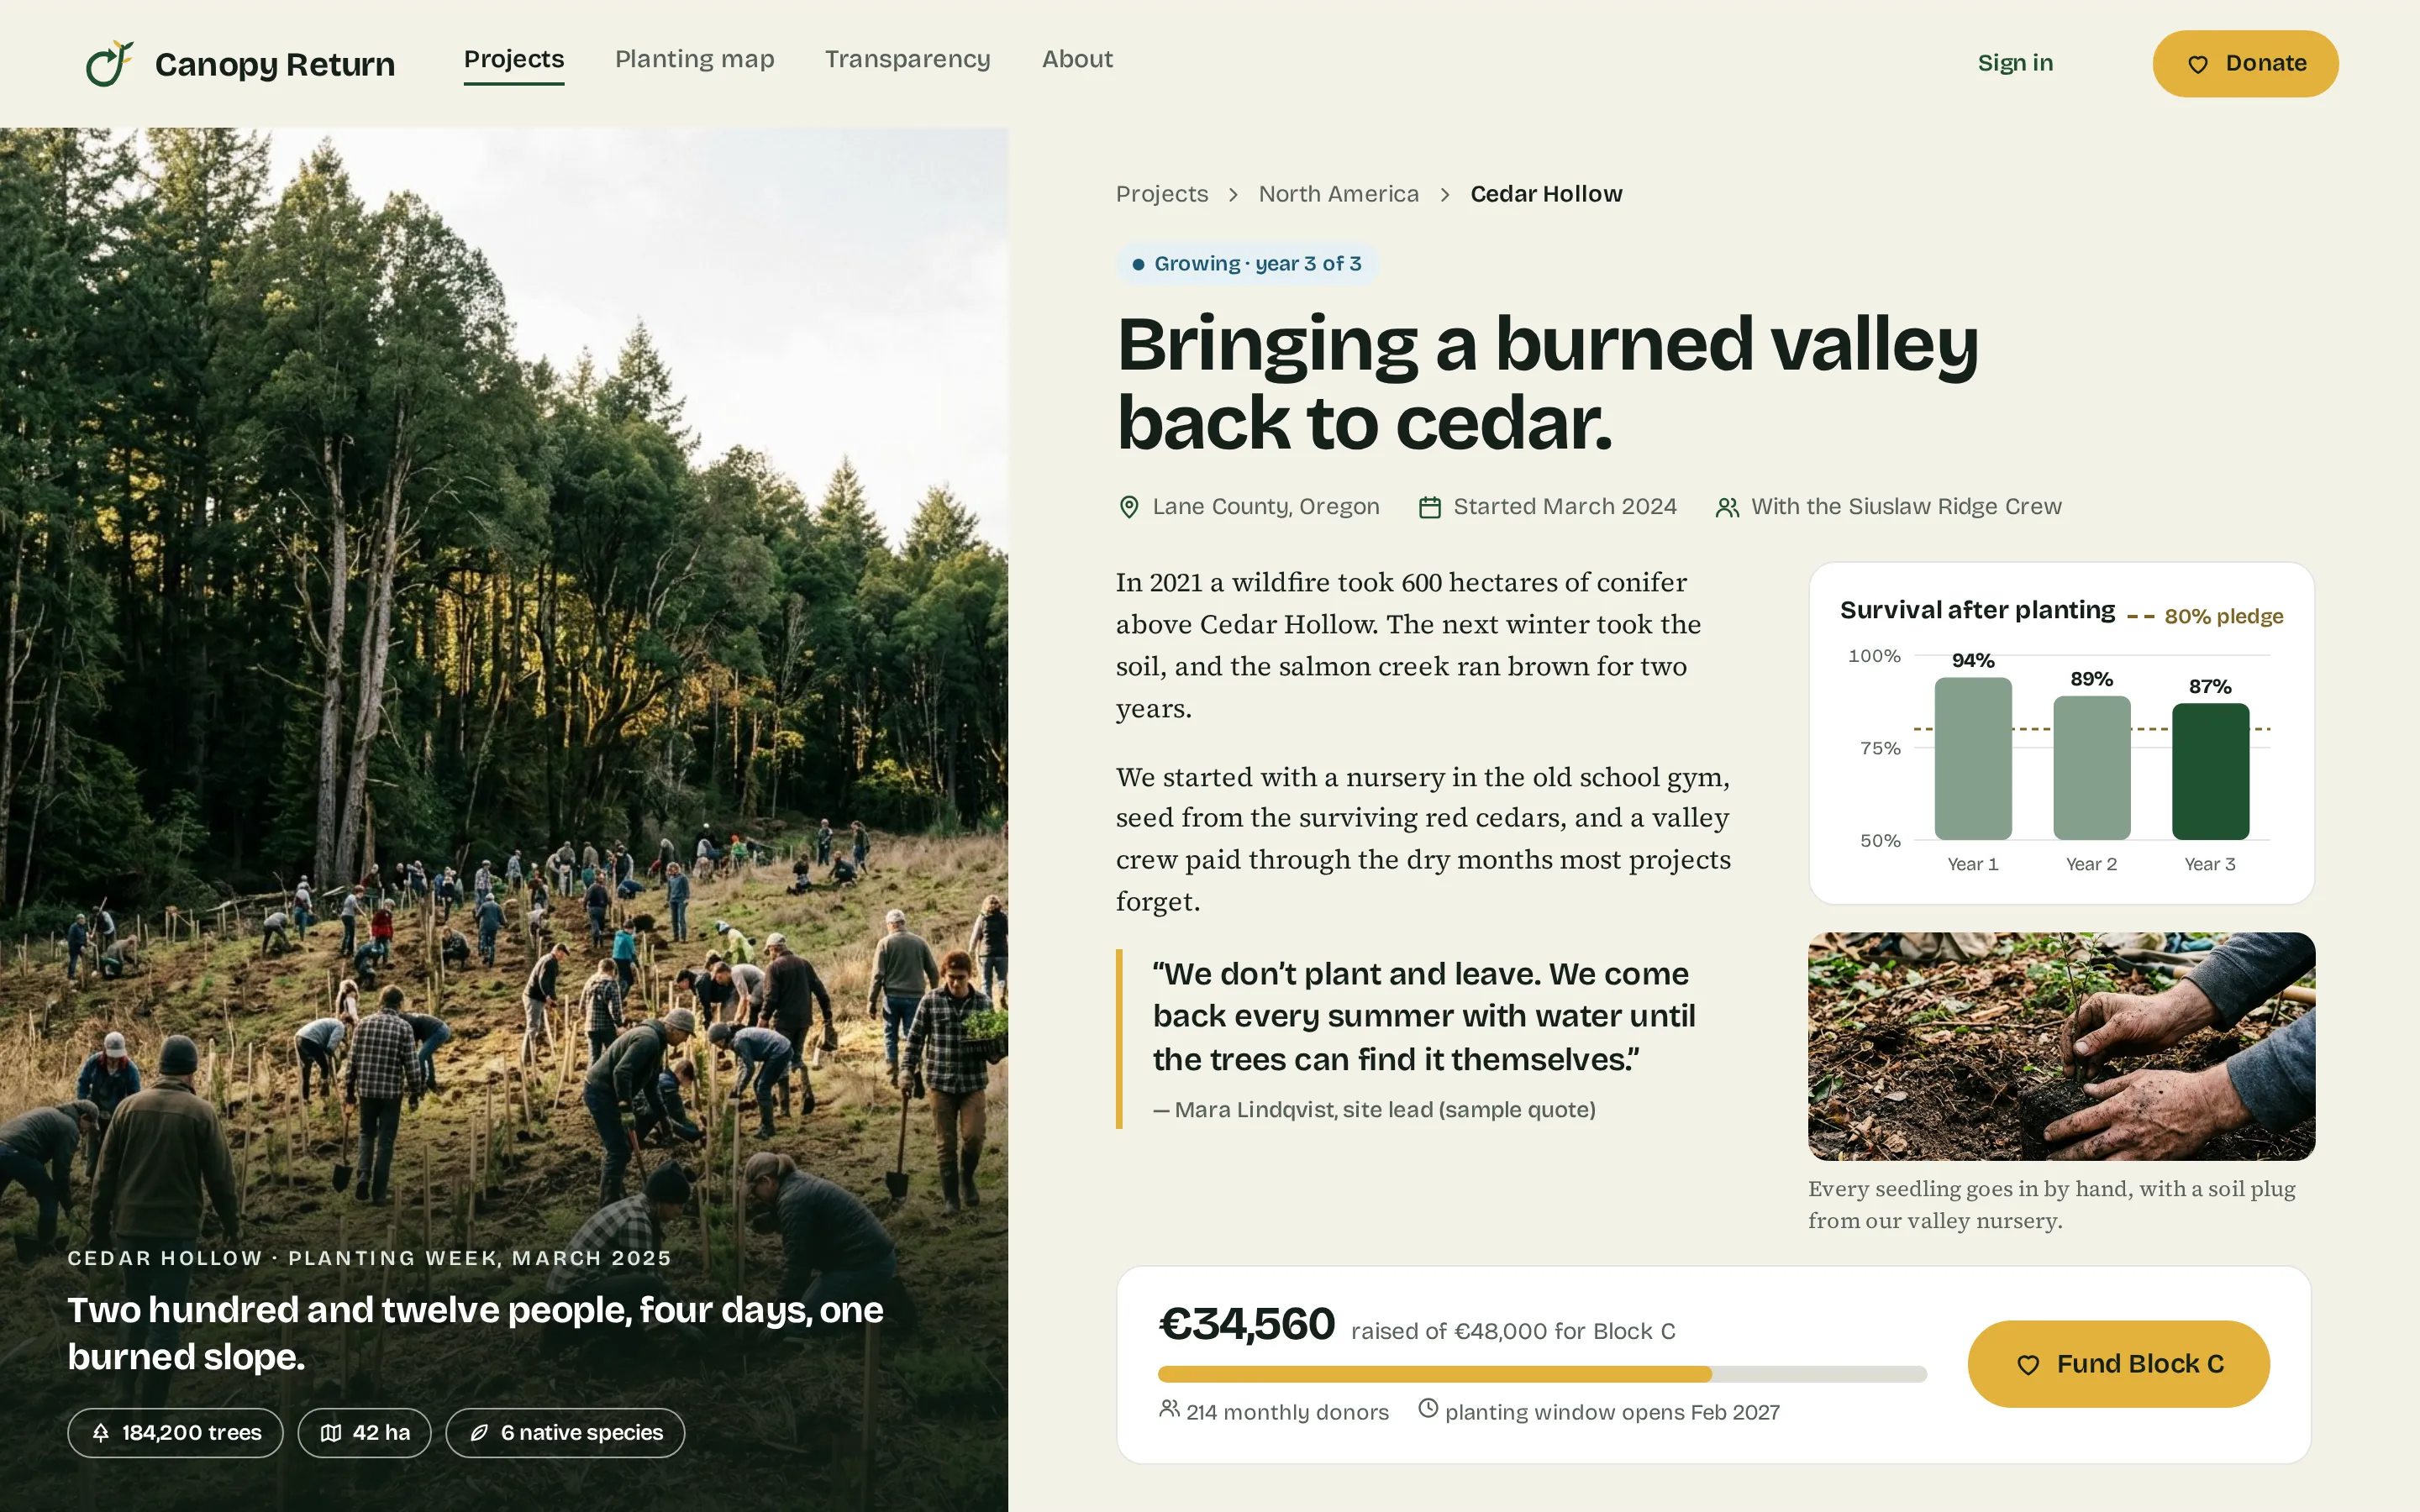
A wide hero with a 4-column KPI row; the map is a list-plus-canvas split; the story page gives the photo the full height and the text a reading column.
- 03
States
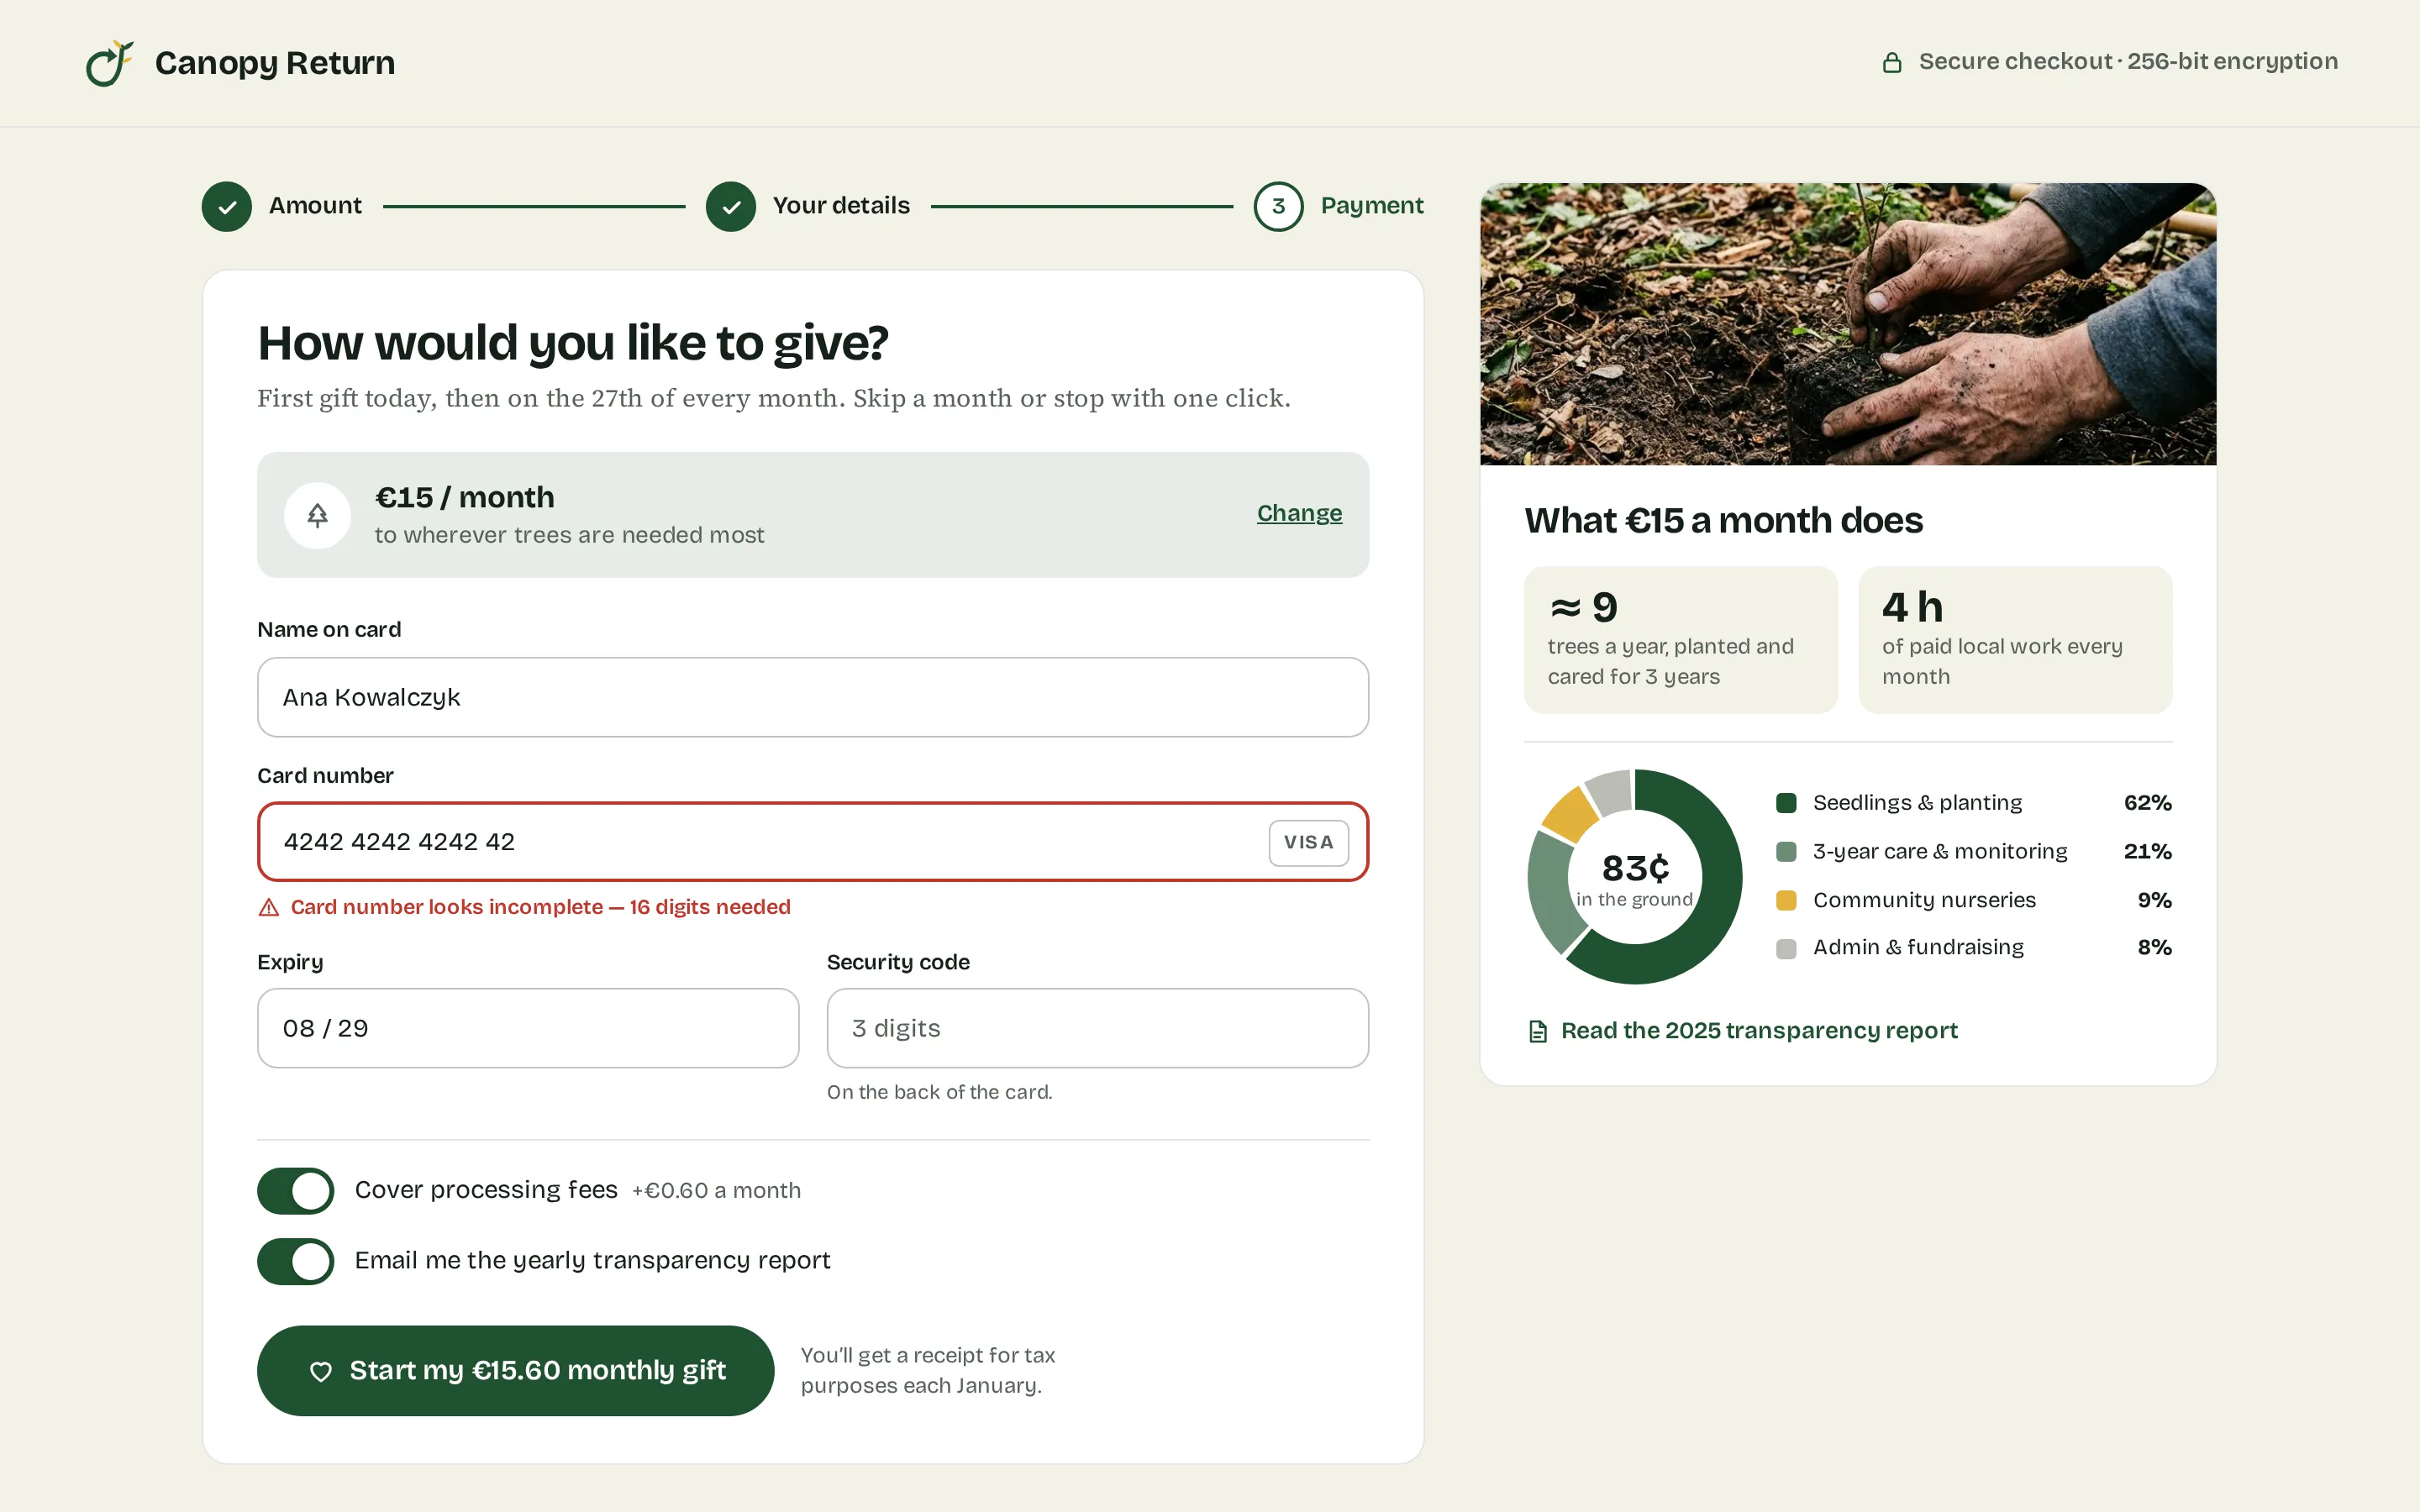
One-off / monthly, a selected amount, a selected and a hovered site, planted / planned blocks, the block popover, a card-number error, a CVC hint and fee-cover toggles.
- 04
Data on image
Trees, hectares and species sit on the planting-week photo; block labels and polygons sit on the aerial view — every number is next to the place it describes.
- 05
Gold means give
Seed gold is used only for actions that give money — Donate, Give monthly, Fund Block C — so the eye learns where the ask is.
- 06
Real-looking data
Twelve sites in nine countries, an 18,400-seedling block with 91% survival, a €48,000 goal at 64%, and a €15.60 monthly gift with fees covered.
Canopy green for trust, seed gold for the gift.
Canopy green carries navigation, data and primary actions (9.2:1 with white text); seed gold is 1.74:1 on soil — donate fills with dark text, never text. Bricolage Grotesque sets the headings and UI, Source Serif 4 the stories.
A circular «return» arrow whose tail grows into a sprout with two gold leaves and one green. Picked from four sketched directions as the simplest meaningful sign; reads at 24–32 px.
#1F5130
vs bg 8.16:1 · label 9.22:1
#E3B23C
on bg 1.74:1
#15201A
on bg 14.83:1
#F4F1E8
text on it 14.83:1
#FFFFFF
text on it 16.75:1
#56615A
on bg 5.72:1
Accent / bg 1.74:1 — seed gold is only a fill behind dark text (the donate buttons and goal bars), never text or icons on its own.
Bricolage Grotesque 700Canopy Return
Bricolage Grotesque 700Climate-concerned donors 25–55
Source Serif 4 400 · 16/26A reforestation nonprofit site that proves impact: live planting map, transparent ‘where your money goes’ and a monthly-giving flow.
Source Serif 4 600 · 12nonprofit / climate reforestation
From the counter to the block your money planted.
Home
The live counter over a planting photo, the monthly-giving card with amounts, impact and the goal of one corridor, then four KPIs and a field-notes card.
Planting map
Twelve sites with search, filters, statuses and progress; Cedar Hollow as an aerial view with block polygons by year, the Block B popover with survival, layers, legend and scale.
Project story
A full-height planting photo with data on it, the story in serif, a sample quote, survival against the 80% pledge, and the funding card for Block C.
Monthly giving · step 3
Card details with an incomplete-number error, a CVC hint, fee cover and report toggles; on the right what €15 a month does and the 83¢ transparency donut.
Component sheet
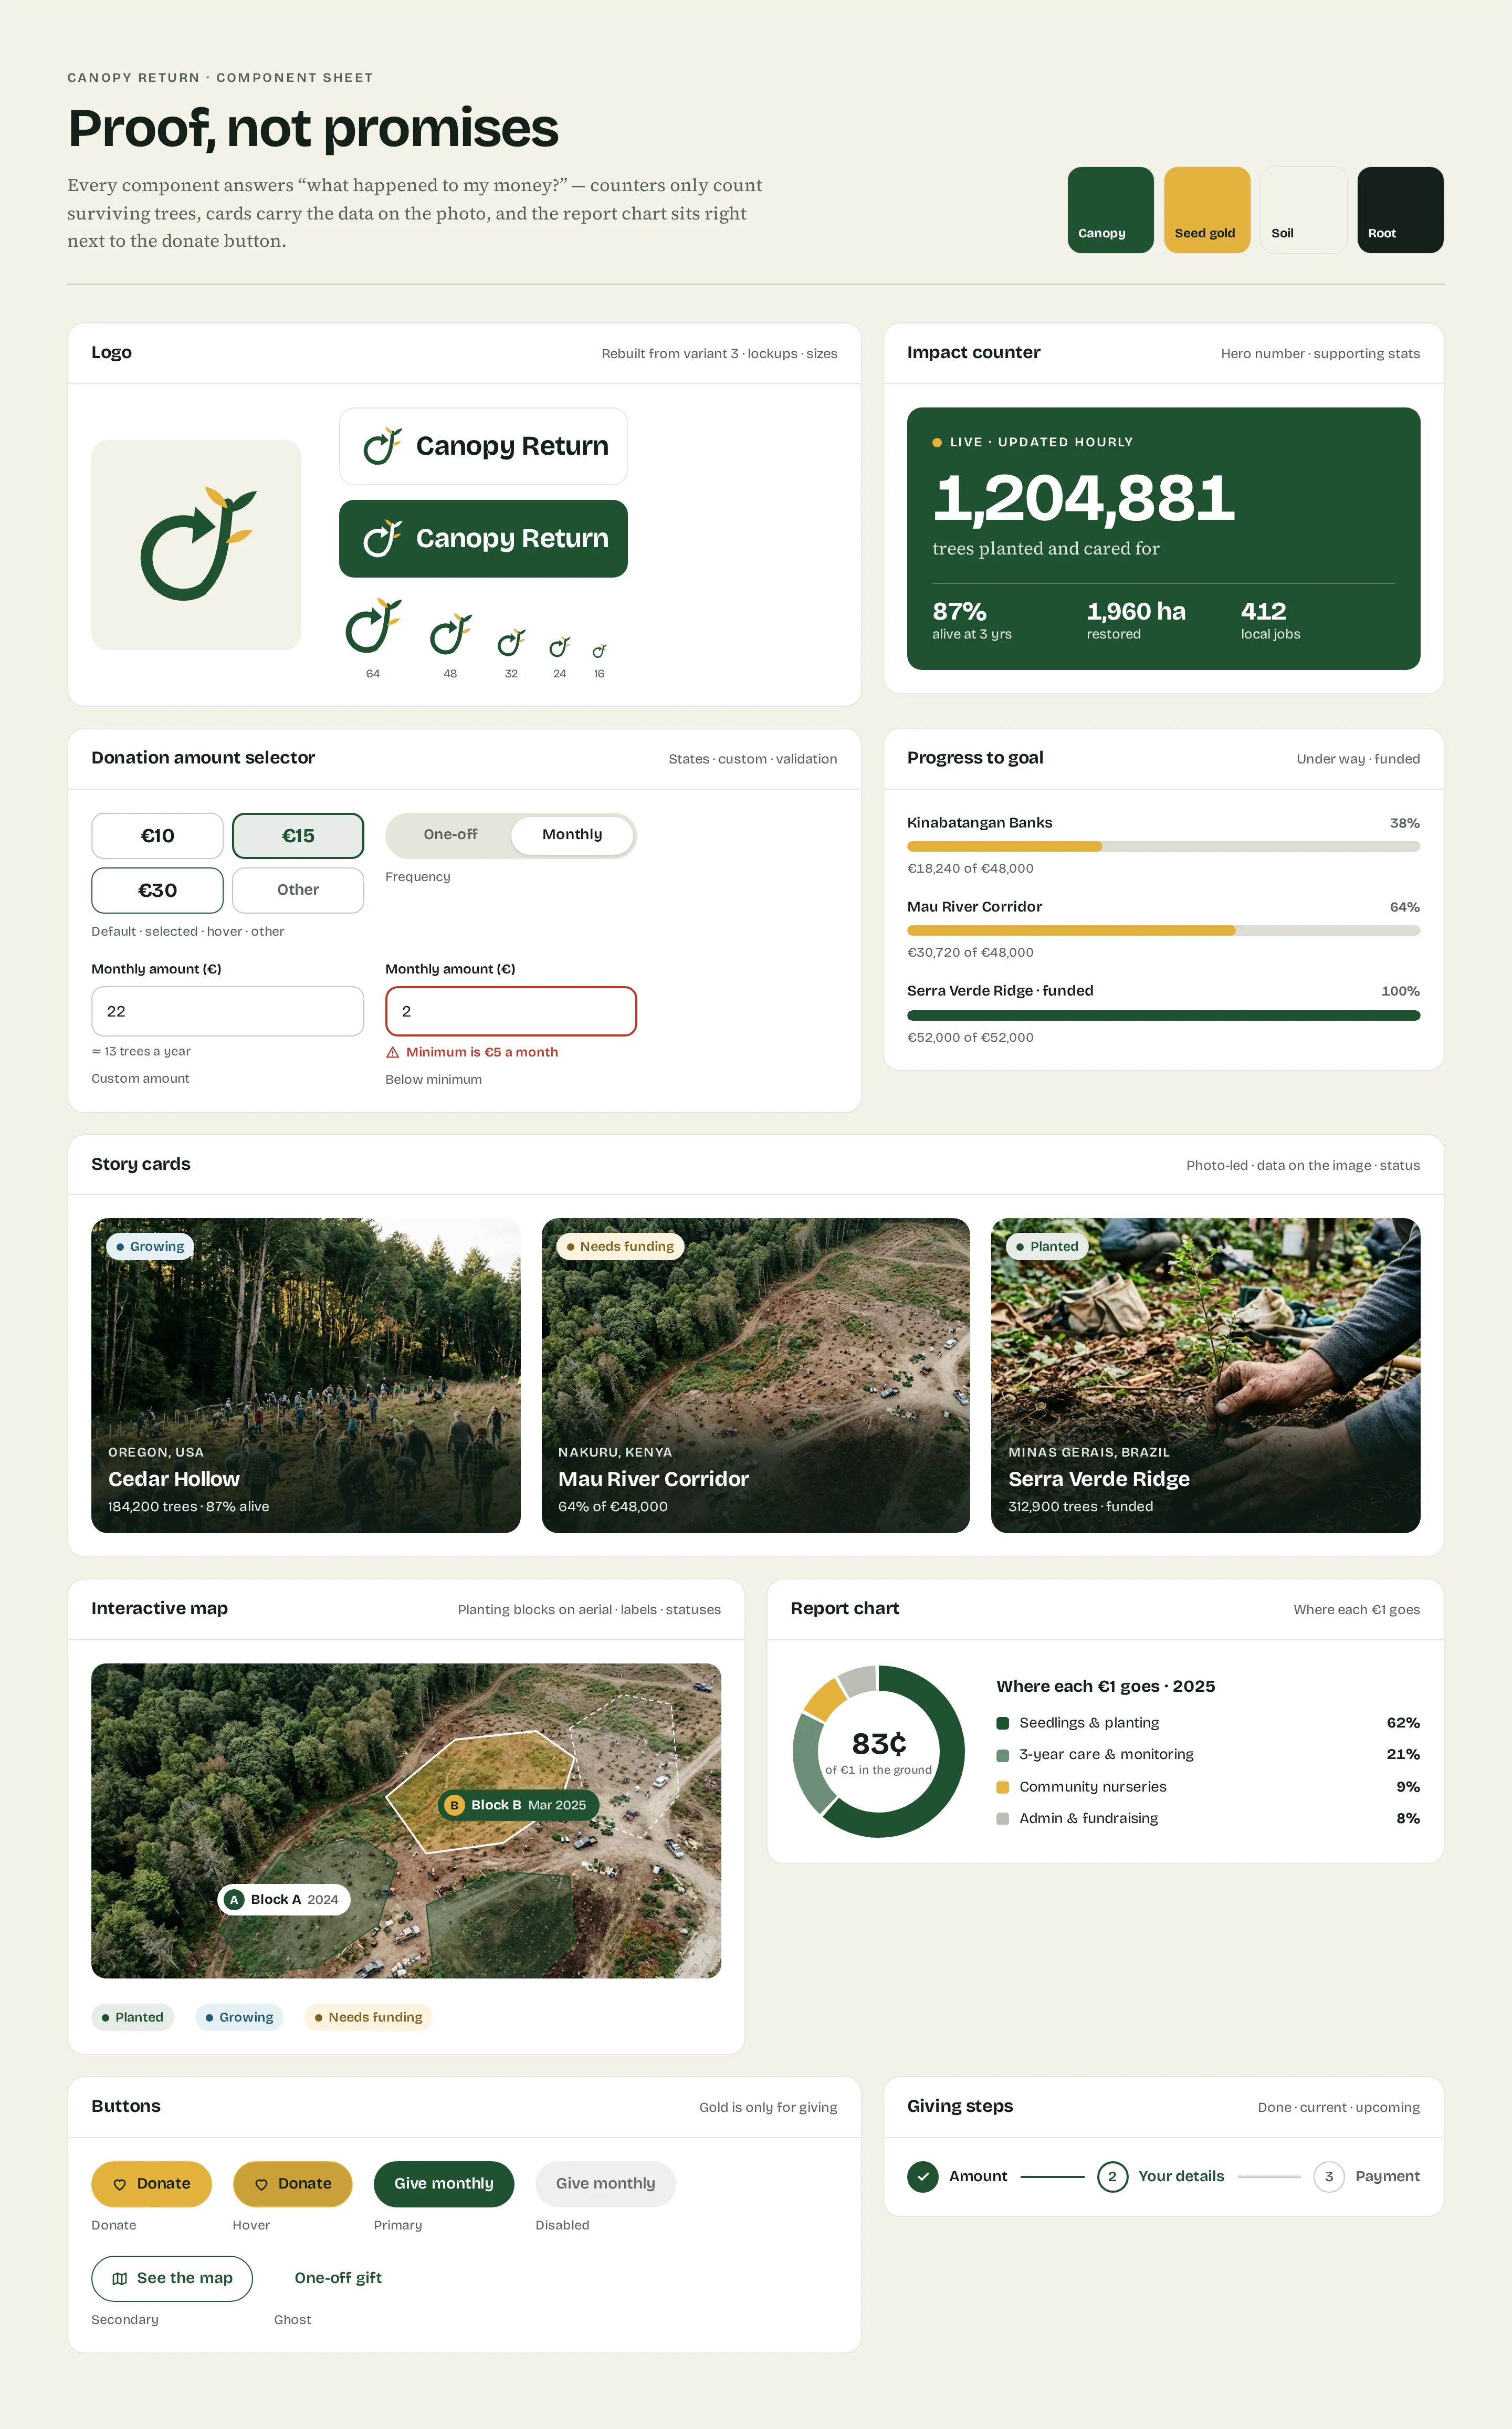
Logo lockups from 64 to 16 px, impact counter, amount selector with states and validation, goal progress, story cards with data on photos, the block map, report chart, buttons and steps.
HopefulGroundedDocumentary
06SEOFound by donors who first ask whether tree planting works.
A reforestation nonprofit is searched for with questions long before it is searched for by name. The plan: make the map and the project data readable to search engines, map donor and company questions to pages, give every site and report its own URL, and keep the photo-heavy stories fast.
A reforestation nonprofit is searched for with questions long before it is searched for by name. The plan: make the map and the project data readable to search engines, map donor and company questions to pages, give every site and report its own URL, and keep the photo-heavy stories fast.
Search snippets as we would write them — titles and descriptions drafted from this concept's own page copy, shown without any search engine's branding.
- 01
Audit
The proof lives in maps and charts — so we check that it also exists as text a crawler can read.
What we check- Site names, years and survival also listed in HTML, not only drawn on the map
- Charts with a text summary and a data table next to them
- Project pages and reports crawlable; the giving steps kept out of the index
- Photo alt text that names the place and the season
- Legal name, registration and contact in the footer of every page
- 02
Keyword map
Most searches here are questions, so the clusters are questions first and the name last.
Example clusters · no volumes, conceptQuestiondoes tree planting worktree survival rate reforestationDonormonthly donation reforestationtransparent tree planting charityCompanycorporate tree planting programreforestation partner csr reportBrandcanopy return projectscanopy return reports - 03
Site structure
Every planting site is a page with its own data, reports have stable URLs, and companies get a page written for them.
Page planStructured dataNGODonateActionArticleDatasetBreadcrumbList/Home/projects/Projects/projects/cedar-hollow/Cedar Hollow/projects/<site>/Twelve site pages
/map/Planting map/reports/Impact reports/partners/For companies/give/Giving steps · noindex
- 04
Speed & Core Web Vitals
The counter and the donation card are the first things a visitor sees — they must not wait for the map.
Targets · 75th percentile of visitsLCP< 2.5 sPlanting photo in AVIF / WebP, preloaded; the counter is text, not an imageINP< 200 msThe map loads after the page is usable; filters respond without blockingCLS< 0.1Counter and donation card keep their space before the numbers arriveThresholds are Google's published «good» values for Core Web Vitals — targets for the build, not measured results.
Questions & answers
Is Canopy Return a real product?
No. Canopy Return is a self-initiated concept by Omnisense — a brief we set ourselves, with no client and no business metrics. The nonprofit, sites, counts, people, partners and the quote are sample data.
Who is the site for?
Climate-concerned donors aged 25–55 who want to see what their money did, and corporate CSR partners who need reportable numbers.
How does the site prove impact?
It counts only trees that survived three seasons, maps every planting block with its year and survival, and shows how each €1 is split right in the checkout.
What did you design?
Home with the impact counter and a donation card, a planting map with blocks drawn over an aerial photo, a project story with a survival chart, and step 3 of monthly giving with the money breakdown.
Did you plan SEO too?
Yes. The plan makes the map and the project data readable to search engines, maps donor and company questions to pages, gives every site and report its own URL, and keeps the photo-heavy stories fast.